Chapter 3 Data and Methods
The microsimulated data contains, 19 variables, 1 of which was determined after generating the microsimulated data (Holiday_type). This is not explicitly defined in the microsimulated data, therefore there are some assumptions that were made to classify the Holiday destinations as either a city or beach, for instance, geographical proximity of the destination airport city to a beach, in this case geographical proximity was considered a proxy for holiday type. As such, out of the 75 unique holiday destinations, 61 are beach holidays and 14 are city holidays. Person_id is a variable describing the unique id of each person in the study area. Zone is a geographical variable that contains the output are classification in Leeds. Oac_group describes the output area classification groups that a person belongs to, the classifications are: “Urbanites,” “Suburbanites,” “Rural Residents,” “Multicultural Metropolitans,” “Hard-pressed Living,” “Ethnicity Central,” “Cosmopolitans” and “Constrained City Dwellers,” but as a factor containing 8 levels each corresponding to a supergroup. The Sex variables describes the sex of the individual, it is either “f” for female or “m” for male. Age_band refers to the age bracket that the individual belongs to, it ranges from “a24under” to “a65over.” Number_children refers to the number of children that the individual has, it ranges from 0 to 4. Household_income refers to the household income of each household, it ranges from “0-10K,” to “81K Plus,” and includes a “Not Answered” category. Overseas_airport refers to the name of the overseas airport the holidaymaker is traveling to. UK_airport refers to the name of the UK airport the holidaymaker is traveling from. Satisfaction_overall, refers to how satisfied the holidaymaker was with their most recent holiday, it ranges from “1_poor” to “4_excellent.” Age_sex refers to a combination of the Sex and Age_band variables, so for instance a female aged between 24-34 would be: “fa24to34,” in contrast a male in the same age bracket would be: “ma24to34.” Similar to Oac_group, the Supergroup_name contains the output area classification group names, however not as factors, but rather, as characters. Dest_airport_name refers to the name of the airport the holidaymakers is traveling to. Dest_airport_city refers to the name of the city the destination airport is in. Dest_airport_country refers to the name of the country the holidaymaker is traveling to. Orig_airport_name refers to the name of the airport the holidaymaker is traveling from. Orig_airport_city refers to the name of the city the origin airport is in. Finally, Holiday_type refers to the type of holiday, classified as either “Beach” or “City” holiday. This is summarised below:
| Variable | Detail |
|---|---|
| Person_id | Unique id of respondentaccross the study area. |
| Zone | The output area classification zone in Leeds. |
| Oac_grp | Description of the super group the output area belongs to. |
| Sex | Sex of the respondent |
| Age_band | Age band the respondent belongs to. |
| Number_children | The number of children the respondent has |
| Household_income | The household income of each respndent |
| Overseas_airport | The name of the overseas airport. |
| UK_airport | Name of the airport in the UK. |
| Satisafaction_overall | Level of satisfaction with most recent holiday. |
| Age_sex | A combination of the sex and age band variables. |
| Supergroup_name | The name of the supergroup the respondent belongs to. |
| Dest_airport_name | The name of the destination airport. |
| Dest_airport_city | The name of the city the destination airport is in. |
| Dest_airport_country | The name of the country the destination airport is in. |
| Orig_airport_name | The name of the origin airport. |
| Orig_airport_city | The name of the city the origin airport is in. |
| Holiday_type | The name of the city the origin airport is in in. |
To get a sense of the nature of the data, the first few entries are shown below:
## # A tibble: 6 × 19
##   person_id zone      oac_grp sex   age_band number_children household_income
##       <dbl> <chr>     <chr>   <fct> <fct>              <dbl> <chr>
## 1        56 E00056750 8       m     a65over                0 Not Answered
## 2        63 E00056750 8       f     a25to34                2 26-30K
## 3       261 E00056750 8       m     a25to34                0 26-30K
## 4       306 E00056750 8       m     a65over                0 Not Answered
## 5       326 E00056750 8       m     a50to64                0 Not Answered
## 6       348 E00056750 8       m     a25to34                2 Not Answered
## # … with 12 more variables: overseas_airport <chr>, uk_airport <chr>,
## #   satisfaction_overall <chr>, age_sex <fct>, supergroup_name <chr>,
## #   dest_airport_name <chr>, dest_airport_city <chr>,
## #   dest_airport_country <chr>, orig_airport_name <chr>,
## #   orig_airport_city <chr>, orig_airport_country <chr>, Holiday_type <chr>
One of the key assumptions made when generating the microsimulated data, was that the data is fully representative, however is this really the case? It is natural that certain output areas in Leeds will be better represented by the individual-level survey, in comparison to others. The figure below demonstrates the model uncertainty, the extent to which oversampling has occurred. Oversampling in this context refers to cases in which the same respondent has been reassigned to the same Output area several times. The figure below demonstrates the distribution of the Output Areas that are not as well represented by the individual-level survey data.
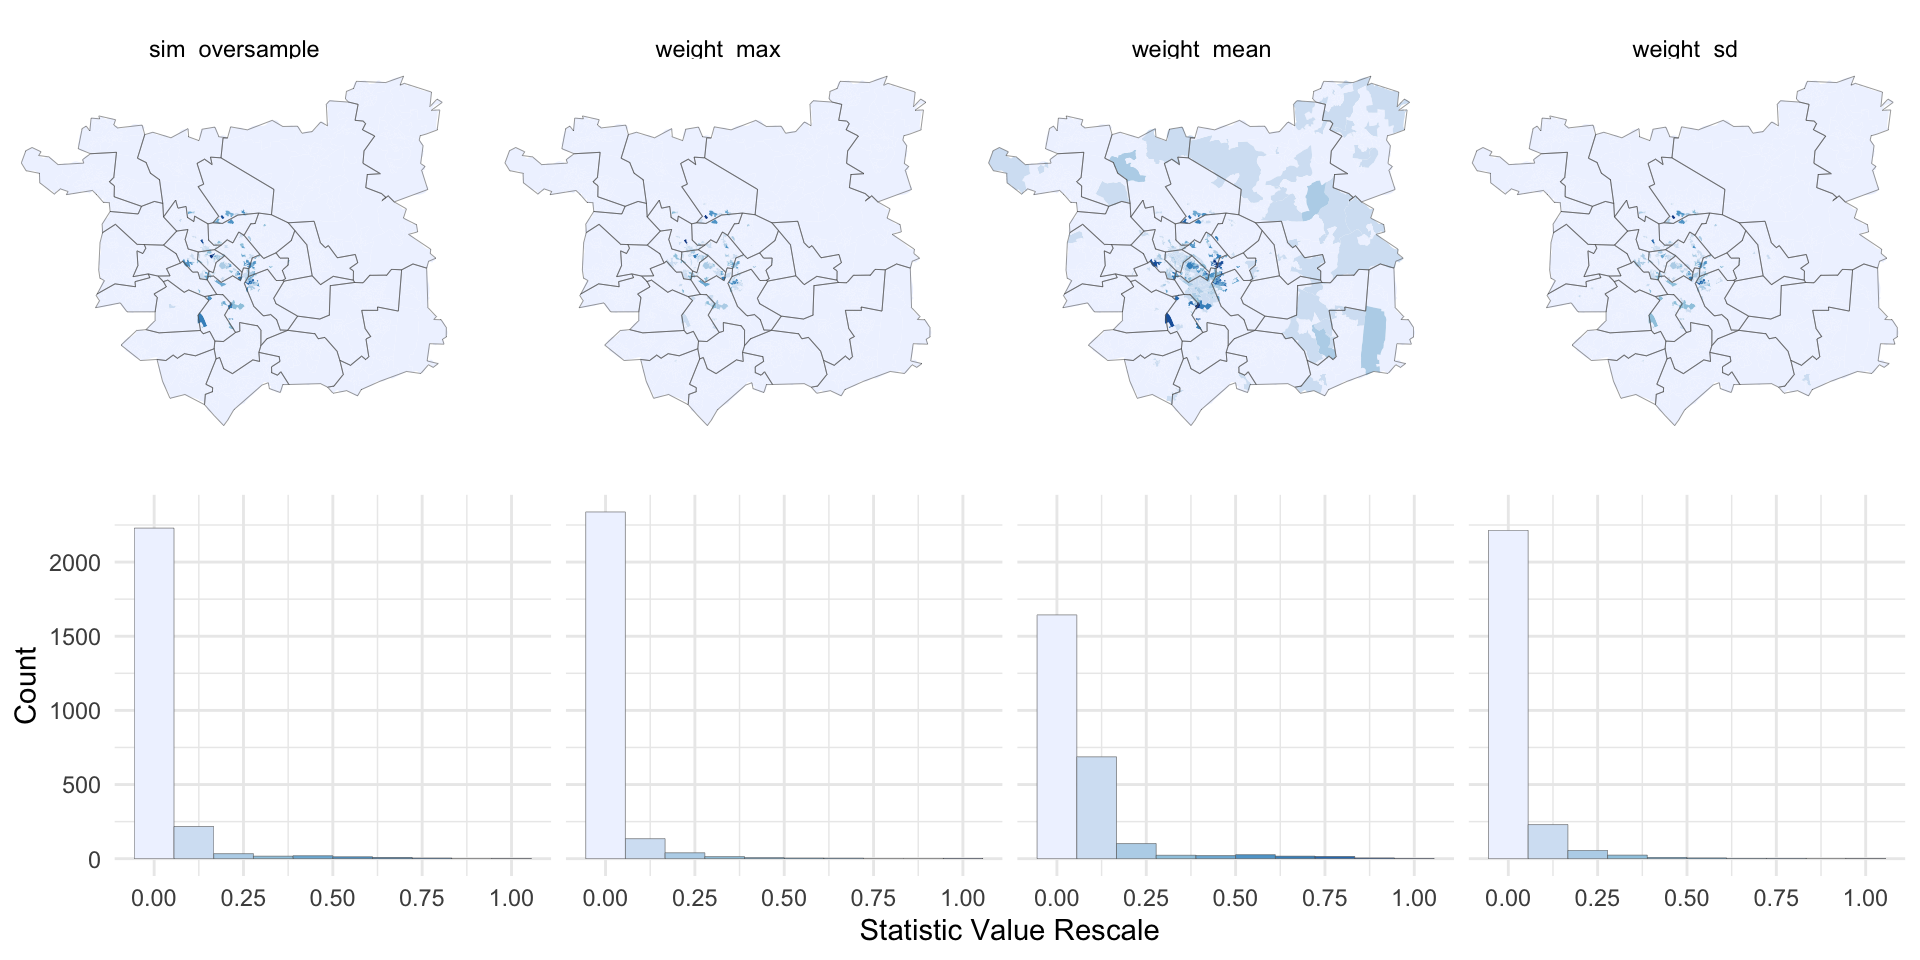
Figure 3.1: Simulation Oversampling
By grouping the weights used to generate the microsimulated data, the extent of oversampling can be visualised. There seems to be a higher concentration of oversampling, particularly near the city region and its immediate periphery, as evident by the darker shades of blue in the choropleth map. Similarly given the scope of the report, it would be useful to breakdown the top locations by holiday type. The figure below shows the top destinations by holiday type.
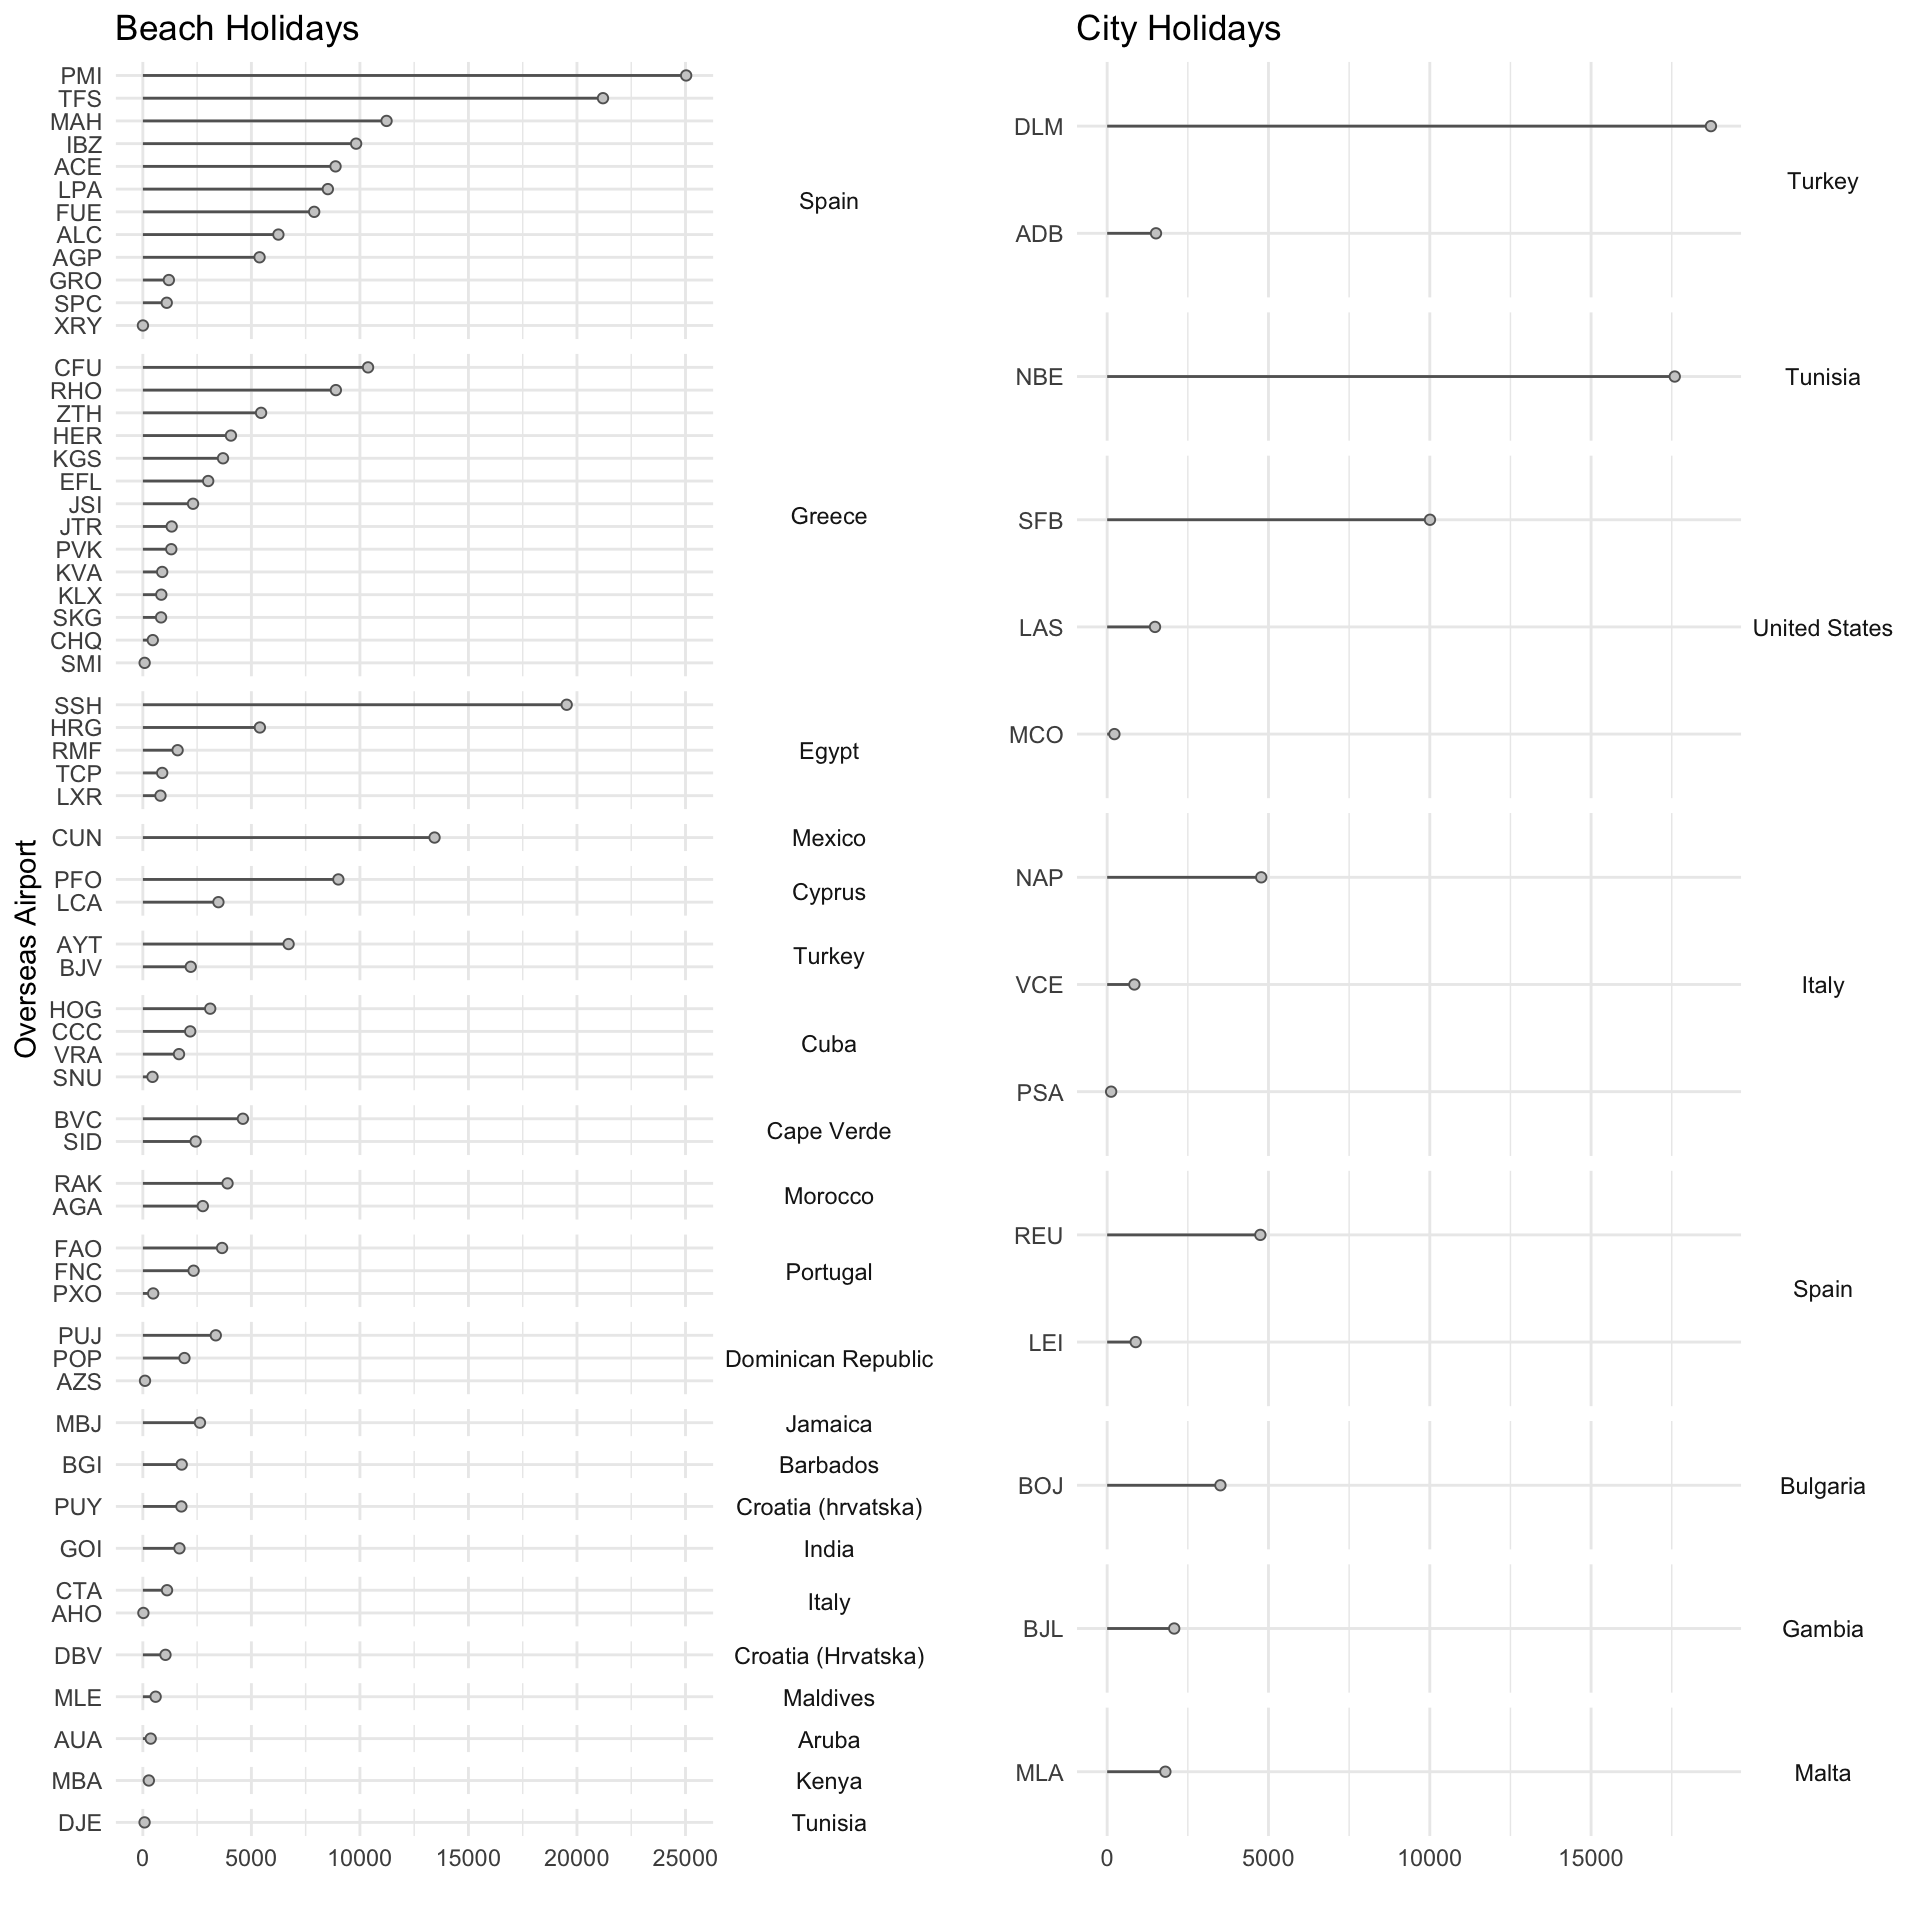
Figure 3.2: Top Destinations by Holiday Type
It seems that the top destinations for beach holidays are Spain, Greece and Egypt. In contrast, and perhaps more importantly given the scope of this report, the top destinations for city holidays are Turkey, Tunisia, and The United States. As outlined in the introduction, we are interested in the city holidays in the United States, which in this case are Orlando, Florida (MCO & SFB) and Las Vegas, Nevada (LAS). Now that we have a clearer idea of our destinations in the United States, we can profile the holidaymakers traveling to these locations. This is discussed in the next section.