Chapter 4 Results
Now that we have the list of city destinations, it would be useful to profile the known population holidaying to these destinations. A useful comparison would be to compare the customer population holidaying to these locations with the Leeds holiday making population as a whole. The figure 3 demonstrates the extent to which the holiday makers to the destinations of interest differ from the Leeds holiday-making population, particularly in terms of 5 demographic variables, age band, household income, number of children, overall satisfaction and supergroup name. From the figure below3, a consumer profile of holidaymakers to American cities starts to emerge. Consumers traveling to these locations are aged between 35 to 49, have a household income of between 41-50 thousand, have children, there seems to be a concentration of consumers with 2 children, were poorly satisfied with their most recent holiday and belong to the Suburbanites super group. From this it can be inferred that the consumers holidaying to these locations are young professionals, living in suburban areas, have a comfortable income, and have at least one child.
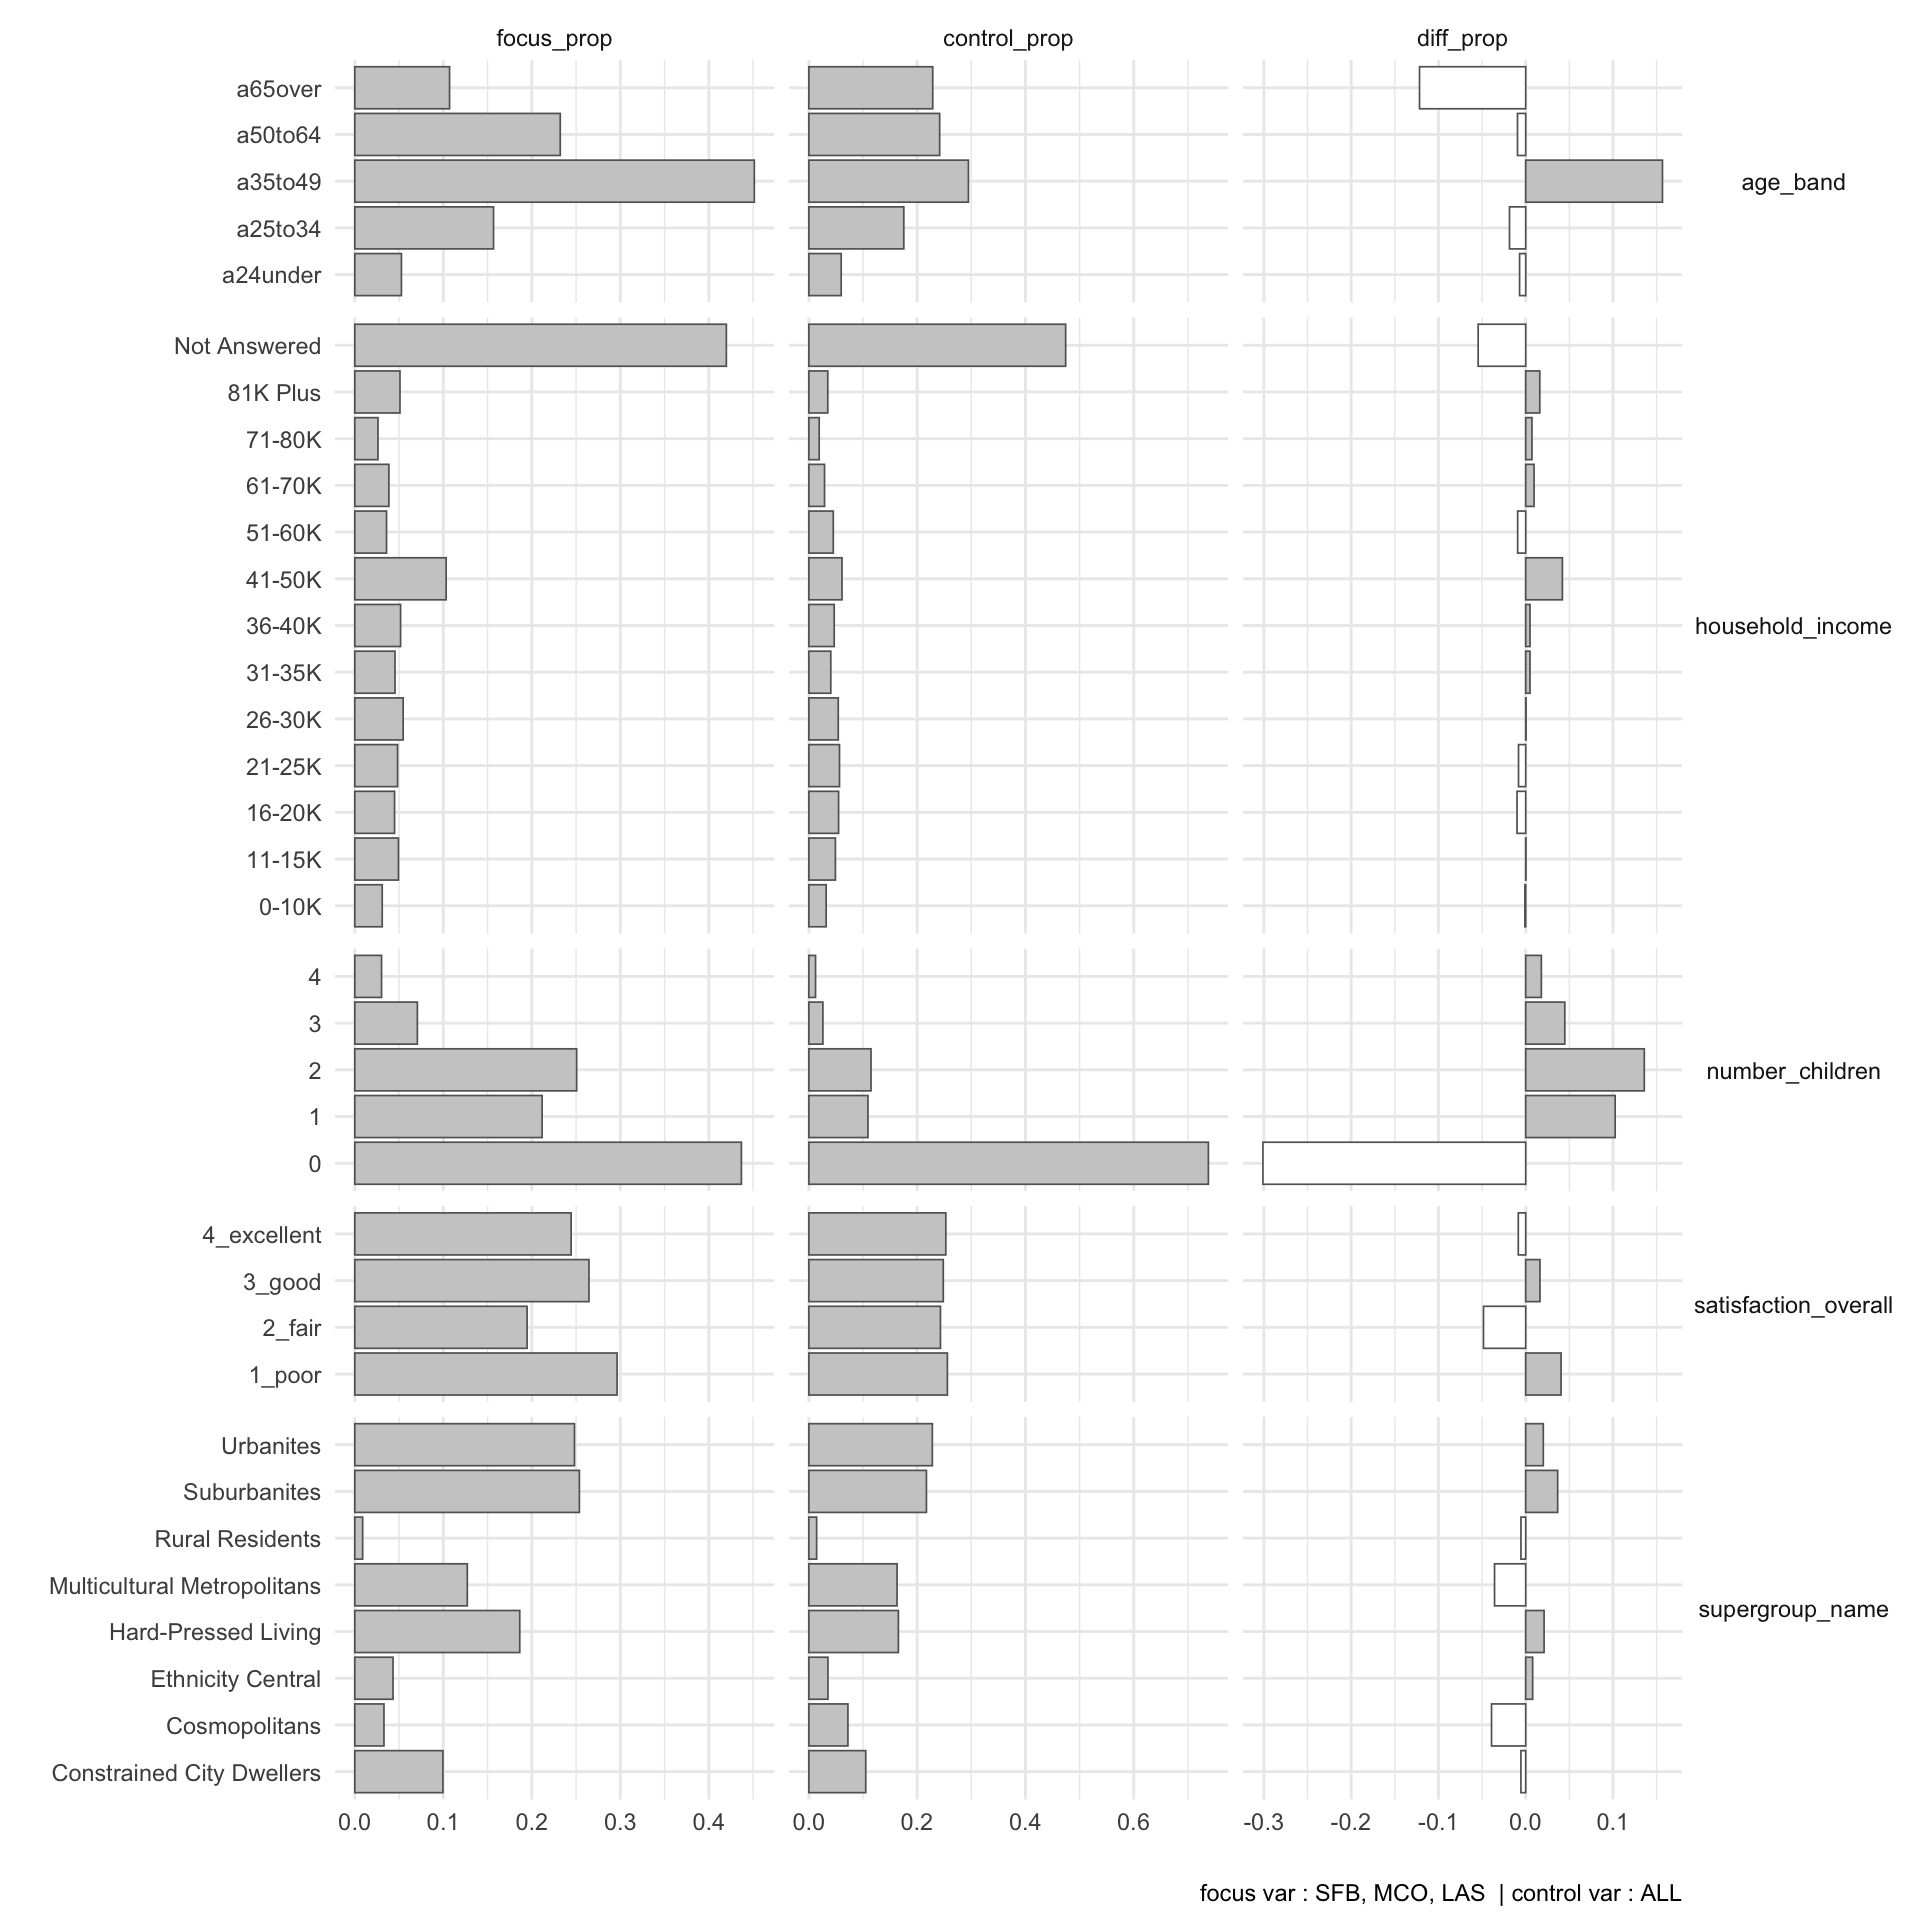
Figure 4.1: Difference in Proportion of Characteristics off Holidaymakers to Orlando and Las Vegas
Expanding upon these findings, it is possible to map the geographical distribution of holidaymakers with the distinguishing characteristics, in this case in the age band 35 to 49, have at least one child, are suburbanites, and were poorly satisfied with their most recent holiday. Unsurprisingly, given that the holidaymakers traveling to the destinations of interest are distinctively suburbanites, the figure below shows that they are located towards the peripheries of the study area or in areas that can be considered more suburban. In fact, upon closer inspection, it seems that there are no/close to zero holidaymakers in the city centre and its immediate periphery traveling to the locations of interest.
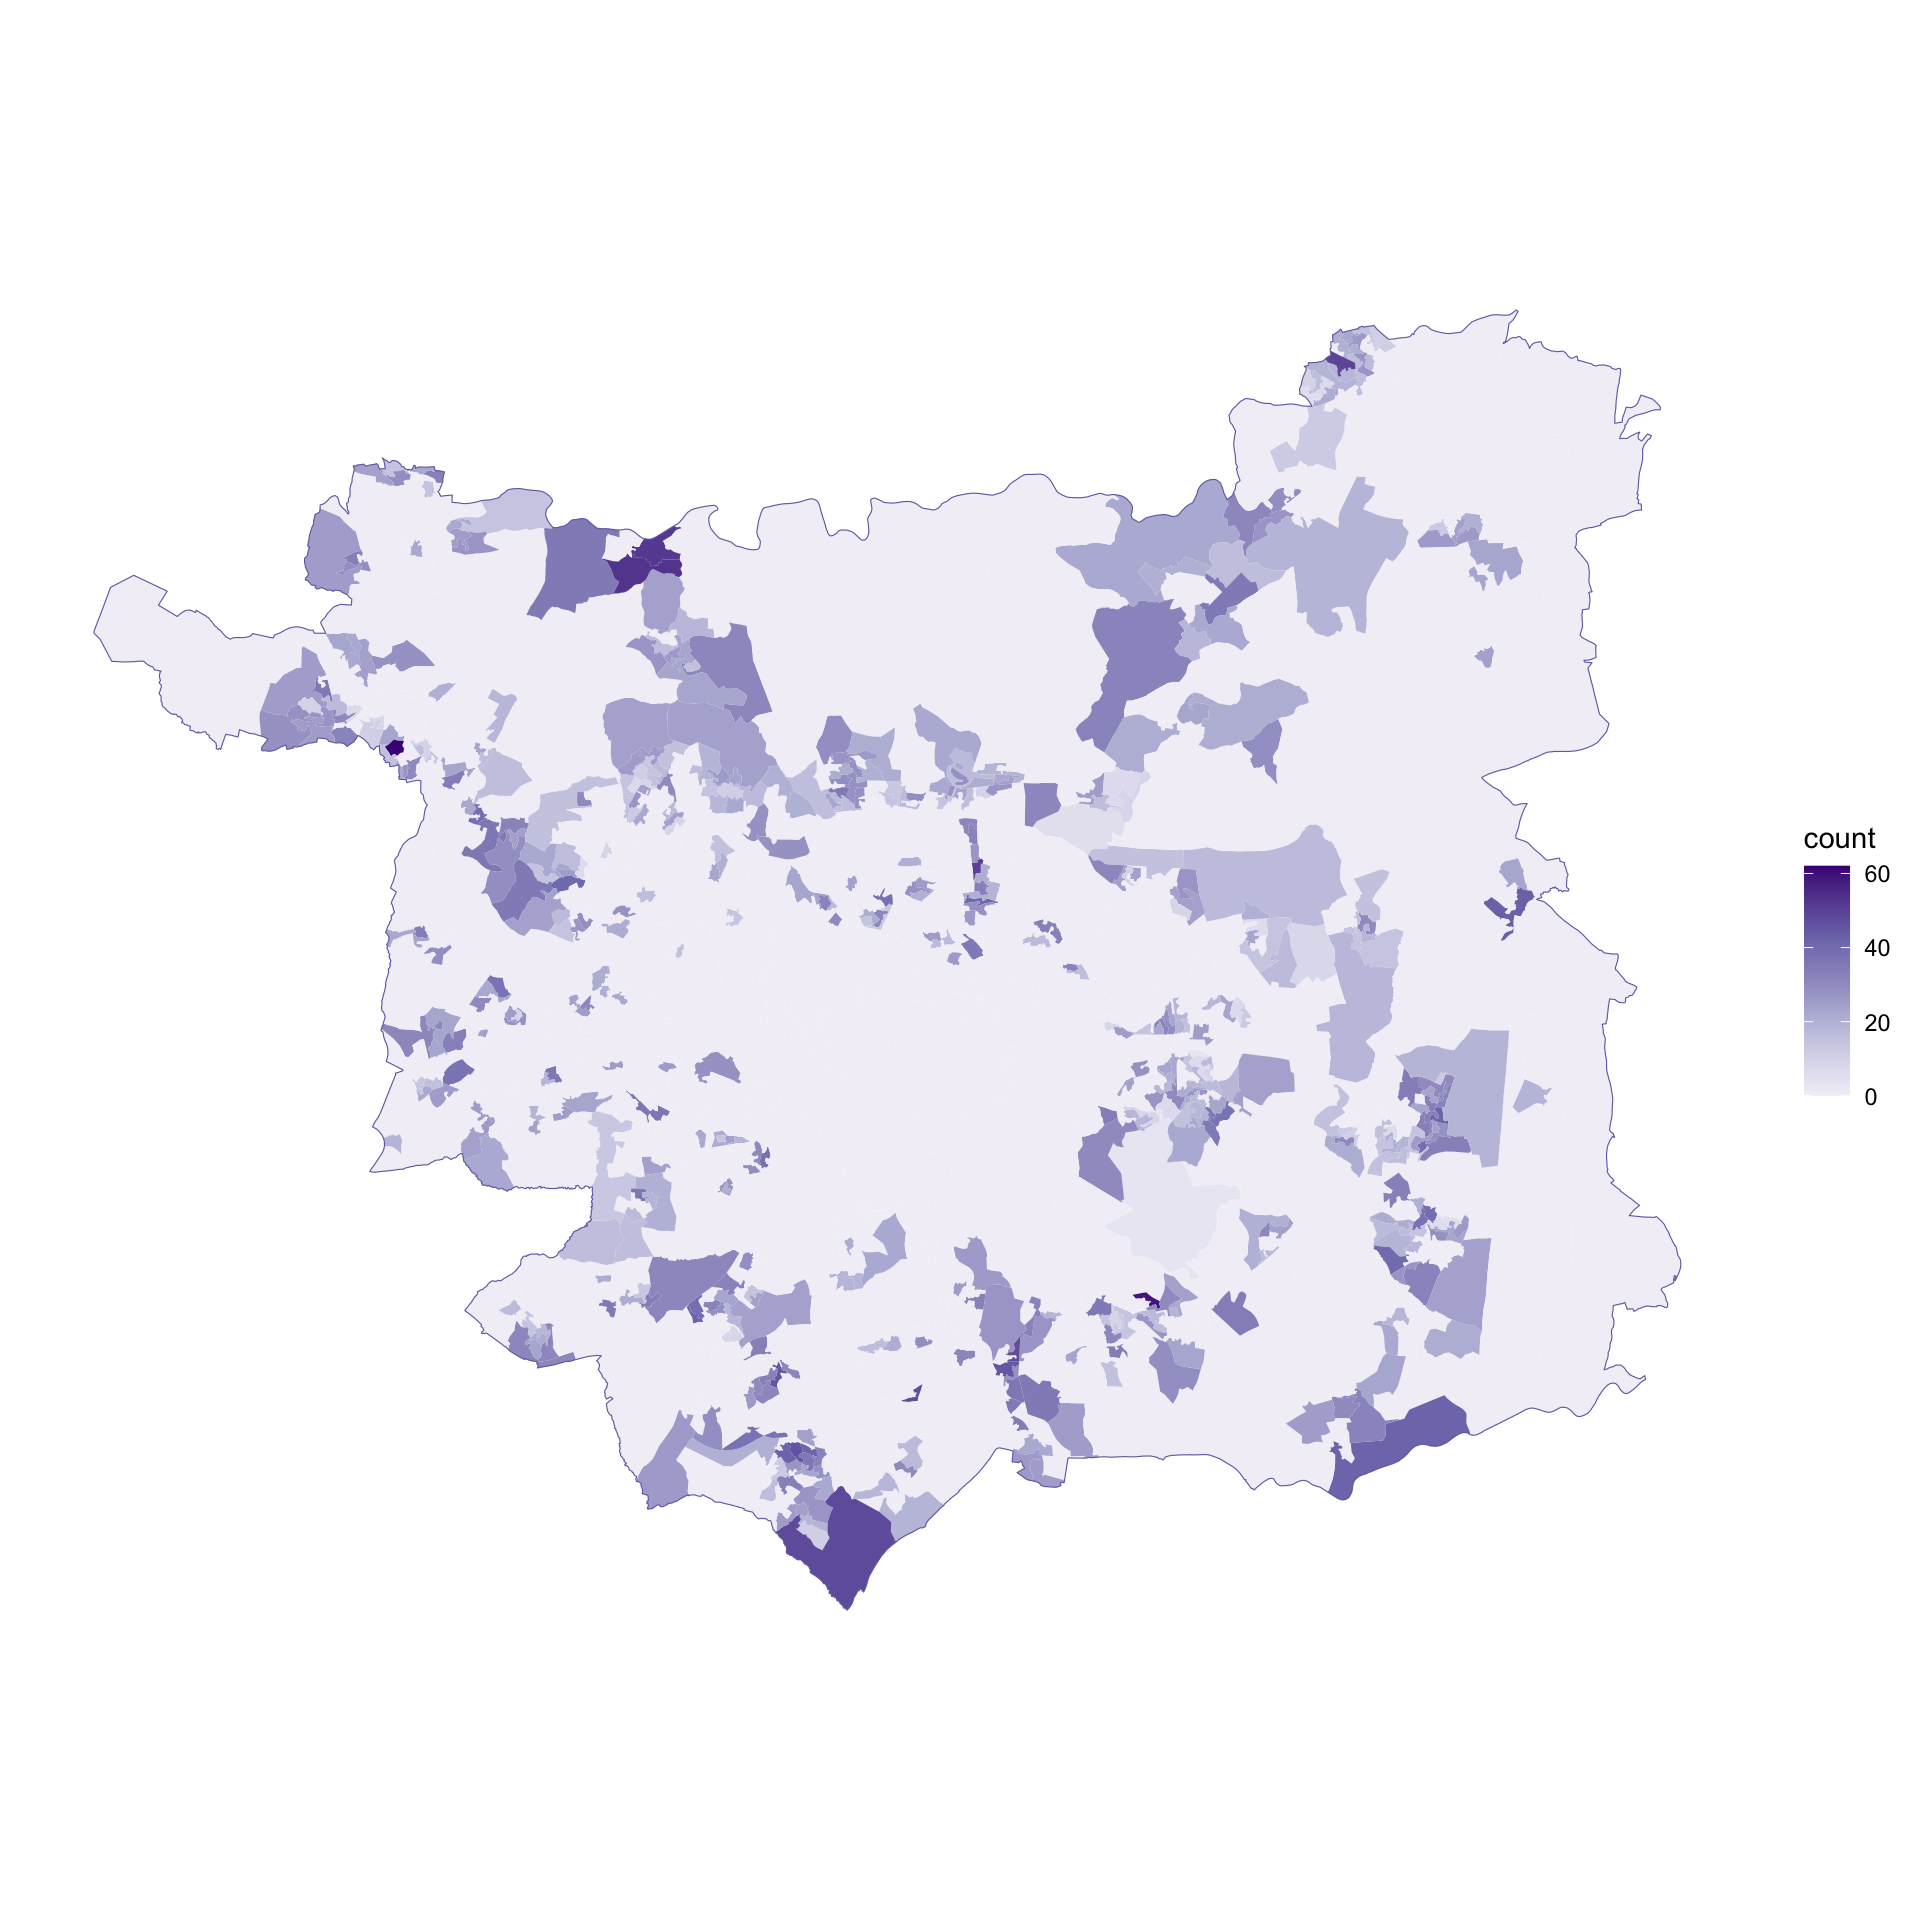
Figure 4.2: Geographical Distribution of Target Market